Predicting the price of gold
My friend Steve showed me this
article by Eddy Elfenbein, which hypothesizes a relationship between real interest rates and gold's price, roughly that low real interest rates foreshadow rising gold prices. This wasn't something I'd thought about so I decided to take a look.
This first image “pictures” the model. The picture begins on 1 January 1972, the year after the
Nixon Shock floated the dollar price of gold. Note that the horizontal real line is at 2%, which is his decisive level. He claims that gold rises when the blue curve is below the line (i.e. when the real interest rate is less than 2%), and falls when the blue curve is above the line. By the way, the
real interest rate just means the the interest rate you expect to earn after accounting for inflation. (Received wisdom regards a positive rate as economically healthy and a negative rate as economically foreboding. You can calculate it in different ways; here I've simply subtracted the federal funds rate from the consumer price index (CPI).)
(Elfenbein claims a lot more, namely that the regression coefficient is basically 8, meaning that for every 1% difference from the horizontal line, gold moves 8% annually. But he concedes that that coefficient is only good for the last ~15 years. IOW, he is conceding that the “model” is not too useful if you don’t know what coefficient to use for the next 15 years.)
But probably the interesting question is whether the model even gets the direction of gold’s price movement right. You can see that it does pretty well in many time periods, but not well in a few time periods.

Note that with these kinds of “signals” there’s always the issue of what constitutes a meaningful crossing of the 2% line.
So that’s a pretty picture, but what can be illuminating (albeit less pretty) is a cross-correlation like this:

Here’s what it means. First the window bounded by the 2 dashed horizontal lines is the window of insignificance. So you should only heed the bars that extend above or below that window. The bars themselves are separated horizontally by 1 month intervals. At lag 0, the bar is about -.18. Thus in any given month you should expect the correlation between the real rate and gold’s price change to be -.18. At lag 1, it looks like about -.17. This means the correlation between the real rate in any given month and gold’s price change one month earlier is -.17.
Note the longest bar, about -.19, at lag 9. That says the correlation between the real rate and gold’s price change 9 months earlier is -.19. You get the drift: the preponderance of long bars to the right of lag 0 is telling us that gold’s price changes are a leading indicator for real interest rates, not the other way around! I think this is one of those fundamental financial facts of life: Markets lead data; data don’t lead markets. This is counter-intuitive because everyone sees the markets pop right after the release of surprising economic data. But nobody consistently makes money trading after those releases, except maybe some High Frequency Traders.
Despite the window of insignificance, it’s striking that the correlation is consistently negative, indeed never positive, for a full 2 years of lags in either direction. In that sense Elfenbein is on to something: low real rates seem to correlate consistently with gold bull markets (and high real rates with gold bear markets).
Inflation and the money supply
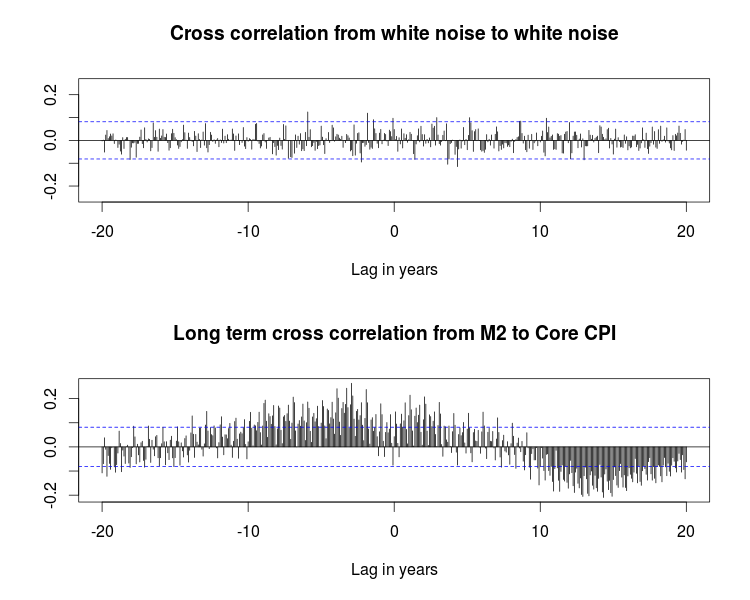
Let's switch gears to inflation. When a central bank injects money into an economy, does inflation ensue? How soon? Using the cross correlation technique above, here's the relationship. The top chart shows a typical scenario in which the two time series are completely unrelated.
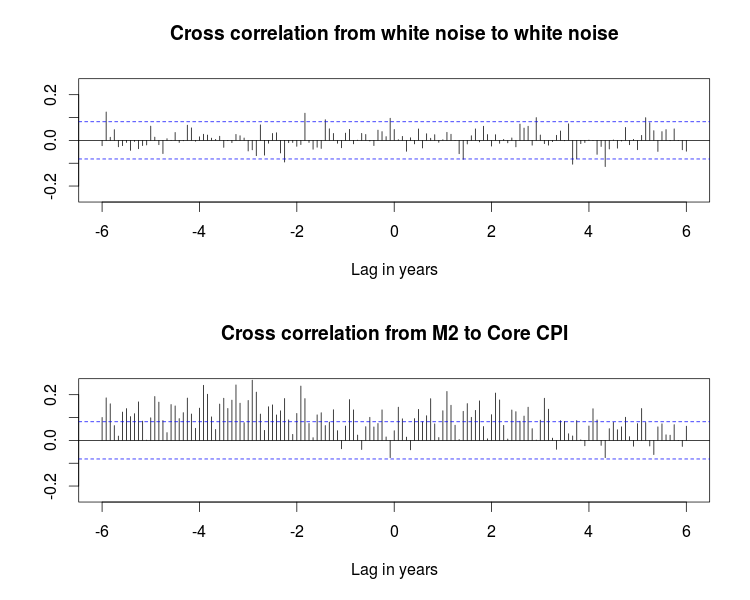
You can see that money supply growth leads inflation by about three or four years. The picture also shows the opposite: inflation leads money supply growth by a couple of years. The underlying time series here are the monthly percentage change in money supply (M2) and the monthly percentage change in the core consumer price index (core CPI).
On a longer time scale money supply follows inflation in the opposite direction: increasing inflation is followed 12 to 15 years later by a slowing in money supply growth: